Posted on

查看普羅米修斯監控目標的exporter資訊

Prometheus Target

普羅米修斯 (Prometheus) 是一套開源的監控系統,其中一個重要的功能就是監控 Service (服務) 的運作狀態,這個功能被稱為 Service Monitoring。

Service Monitoring 可以藉由 exporter,透過定義 HTTP endpoints 的方式,監控這些服務的運作狀態。普羅米修斯會定期呼叫這些 endpoints ,並且收集回應的 metrics 以了解服務是否正常運作、服務的吞吐量、延遲、錯誤率等相關資訊。

Service Monitoring 可以提供以下的監控能力:

  • 監控服務的可用性,例如偵測服務是否還在運作、是否正常回應等等。
  • 監控服務的效能,例如服務的吞吐量、延遲等等。
  • 記錄服務的執行狀態,例如錯誤率、請求數量、處理時間等等。
  • 透過 Service Monitoring,可以提升系統的可用性、效能及穩定性,讓系統管理者能夠更快速地偵測到問題、快速修復問題,降低系統的 downtime,提高系統的可靠度。

如何瀏覽exporter的內容

先到普羅米修斯的網頁的Target的地方,會可以看到現在的監控目標,如果設定的目標沒有正確出現,則可以去Service Discovery的頁籤去確認原因。

內容長這樣
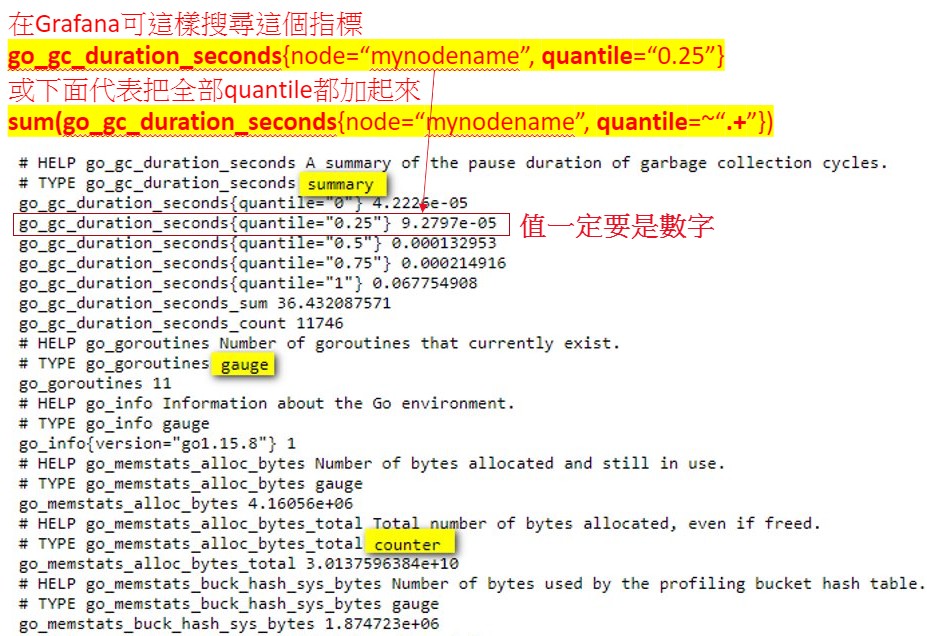
無法存取rancher-monitoring-kubelet的exporter吐出的內容


serviceMonitor/kube-system/rancher-monitoring-kubelet/1 (7/7 up)
普羅米修斯在取得Pod的相關狀態是利用rancher-monitoring-kubelet這個POD來取得相關資訊,但是我們會沒有辦法直接去讀取https://127.0.0.1:10250/metrics/cadvisor這個網址,這是因為要讀取需要先透過K8S的認證
# 取得該namespace的所有密鑰​
kubectl get secret -n cattle-monitoring-system​

# 取得密鑰的內容​
kubectl -n cattle-monitoring-system get secret rancher-monitoring-prometheus-token-hvlqt -o jsonpath={.data.token} | base64 –d​

# 將pod-exporter的網址後面加上-H並帶入密鑰​
curl https://127.0.0.1:10250/metrics/cadvisor -k -H “Authorization: Bearer token_content_xxxxxxxxxxxxxxxxxxxxxxxxxxxxxxxxxxxxxxxxxxxxxxxxxxxxxxxxxxxxxxxxxxxxxxxxxxxxxxxxxxxxxxxxxxxxxxxxxxxxxxxxxxxxxxxxxxxxxxxxxxxxxxxxxxxxxx”​

Service Monitor抓不到監控目標的可能原因

以下為一個簡單範例

apiVersion: monitoring.coreos.com/v1
kind: ServiceMonitor
metadata:
  generation: 4
  labels:
    app.kubernetes.io/instance: srs-json-exporter
    manager: agent
    operation: Update
  name: json-exporter
  namespace: stu-srs
spec:
  endpoints:
  - interval: 30s
    params:
      module:
      - default
      target:
      - http://127.0.0.1:1985/api/v1/streams/
    port: json-exporter
  jobLabel: jobLabel
  namespaceSelector:
    matchNames:
    - stu-srs
  selector:
    matchLabels:
      app.kubernetes.io/instance: srs-json-exporter

在selector 字段指定要監控的 Service 的標籤選擇器,而不是 Pod 的標籤選擇器。

在這個 YAML 配置文件中,ServiceMonitor 的 selector 字段設置為 matchLabels: app: json-exporter,這代表 ServiceMonitor 將監控符合 app: json-exporter 標籤的 Service。
如果這個 Service 沒有符合 app: json-exporter 標籤,那麼 ServiceMonitor 就無法監控這個 Service。

如果您確認了 Service 的標籤設置是正確的,那麼可能是因為 ServiceMonitor 與 Service 所在的命名空間不匹配,導致 ServiceMonitor 無法監控 Service。
您可以檢查 ServiceMonitor 的 namespaceSelector 設置是否正確。namespaceSelector 字段指定要監控的命名空間。如果這個 Service 所在的命名空間不在 matchNames 列表中,那麼 ServiceMonitor 就無法監控這個 Service。
Posted on

什麼是WebRTC

文章轉載

這篇文章翻譯自: What is WebRTC and how does it work? Real-time communication with WebRTC

什麼是WebRTC

WebRTC代表網路實時通訊。 它是一種非常令人興奮、強大且具有高度破壞性的尖端技術和流媒體協議。

WebRTC與HTML5相容,您可以使用它直接在瀏覽器和裝置之間新增實時媒體通訊。 最好的部分之一是,您無需在瀏覽器中安裝外掛的任何先決條件即可做到這一點。 Webrtc正逐漸得到所有主要現代瀏覽器供應商的支援,包括Safari、Google Chrome、Firefox、Opera等。

多虧了WebRTC影片流技術,您可以將實時影片直接嵌入到基於瀏覽器的解決方案中,為您的觀眾創造引人入勝的互動式流媒體體驗,而不必擔心延遲。

現在,影片,特別是直播,是我們快速變化的通訊需求不可或缺的一部分。 隨著社交距離的增加,WebRTC幫助我們滿足這些通訊需求,並增加我們與實時通訊的互動。

WebRTC元件

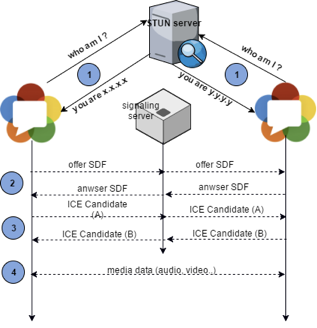
我們將使用客戶端-A和客戶端-B作為示例來解釋WebRTC的以下元件。

SDP(會話描述協議)

SDP是一個簡單的基於字串的協議,它在瀏覽器之間共享支援的程式碼器。

在我們的例子中,

  • 客戶端 A 創建其 SDP(稱為報價)並將其保存為本地 SDP,然後與客戶端 B 共享。
  • Client-B收到Client-A的SDP,保存為遠程SDP。
  • 客戶端 B 創建其 SDP(稱為答案)並將其保存為本地 SDP,然後與客戶端 A 共享。
  • Client-A收到Client-B的SDP,保存為遠程SDP。

信令伺服器(Signaling Server)負責等體之間的這些SDP傳輸。

讓我們假設客戶端A可能支援H264、VP8和VP9編解碼器用於影片、Opus和PCM編解碼器用於音訊。 客戶端-B可能只支援H264用於影片,只支援Opus編碼器用於音訊。

在這種情況下,客戶端-A和客戶端-B將使用H264和Opus作為編解碼器。 如果對等體之間沒有共同的程式碼器,則無法建立對等通訊。

ICE(交互連接建立)

Interactive Connectivity Establishment (ICE) 用於 Internet 上的兩個節點必須盡可能直接通信的問題,但是 NAT 和防火牆的存在使得節點之間難以相互通信。

它是一種網絡技術,利用 STUN(NAT 會話遍歷實用程序)和 TURN(在 NAT 周圍使用中繼遍歷)在兩個節點之間建立盡可能直接的連接。

WebRTC STUN 服務器NAT 的會話遍歷實用程序) 

STUN Server負責獲取一台機器的所有地址。例如,我們的計算機通常在 192.168.0.0 網絡中有一個本地地址,當我們連接到www.whatismyip.com時,我們會看到第二個地址,這個 IP 地址實際上是我們互聯網網關(調製解調器,調製解調器,路由器等),所以讓我們定義 STUN 服務器:STUN 服務器讓對等方知道他們的公共和本地 IP 地址。

順便說一下,Google 還提供了一個免費的 STUN 服務器 (stun.l.google.com:19302)。


WebRTC TURN  Server  (繞過NAT使用中繼遍歷)

TURN(Traversal Using Relays around NAT)是一種協議,可幫助 WebRTC 應用程序穿越網絡地址轉換器 (NAT) 或防火牆。TURN Server 允許客戶端通過中間服務器發送和接收數據。

TURN 協議是 STUN 的擴展。 有時,由於 NAT/Firewall,從STUN服務器 獲取的地址不能用於建立對等點之間的對等連接。在這種情況下,數據通過TURN服務器中繼

在我們的例子中,

  • Client-A通過STUN服務器找到自己的本地地址和公網地址,並通過Signaling Server將這些地址發送給Client-B。從 STUN 服務器收到的每個地址都是 ICE 候選地址。
  • Client-B 做同樣的事情,從 STUN 服務器獲取本地和公共 IP 地址,並將這些地址通過 Signaling Server 發送給 Client-A。
  • Client-A 收到 Client-B 的地址並通過發送特殊的 ping 來嘗試每個 IP 地址以創建與 Client-B 的連接。如果客戶端 A 收到來自任何 IP 地址的響應,它會將該地址及其響應時間和其他性能憑證放入列表中。最後,Client-A 根據其性能選擇最佳地址。
  • Client-B 做同樣的事情以連接到 Client-A

RTP(實時協議)

RTP 是在UDP之上傳輸實時數據的成熟協議。在 WebRTC 中,音頻和視頻通過 RTP 傳輸。RTP 有一個姊妹協議,名為 RTCP(實時控制協議),它在 RTP 通信中提供 QoS。RTSP  (實時流協議)在數據通信中也使用 RTP 協議。

WebRTC 信令服務器

最後一部分是Signaling Server,WebRTC 中沒有定義。如上所述,Signaling Server 用於在 Client-A 和 Client-B 之間發送 SDP 字符串和 ICE Candidates。信令服務器還決定哪些對等點相互連接。WebSocket 技術是與信令服務器進行通信的首選方式。

Posted on

用OPENCV繪製垂直線

繪製出穿過這兩個點(10,20)和(50,30)的中心點,並與和這兩點相連的直線垂直的線。

import cv2
import numpy as np

# 創建一個空的圖像,並設置其大小為 100x100 像素,並設置其通道數為 3 (RGB)
img = np.zeros((100, 100, 3), np.uint8)

# 定義點的座標
point1 = (10, 20)
point2 = (50, 30)

# 計算兩個點的中心點座標
center_point = ((point1[0] + point2[0]) // 2, (point1[1] + point2[1]) // 2)

# 繪製出兩個點以及中心點
cv2.circle(img, point1, 2, (0, 0, 255), -1)
cv2.circle(img, point2, 2, (0, 0, 255), -1)
cv2.circle(img, center_point, 2, (0, 255, 0), -1)

# 計算與這兩點相連的直線垂直的線的端點座標
if point1[0] == point2[0]:
    # 如果這兩個點的 x 座標相等,則直接在中心點上下各畫一個點,這兩個點就是線的端點
    line_point1 = (center_point[0], 0)
    line_point2 = (center_point[0], 100)
else:
    # 否則,計算這兩個點之間的斜率
    k = (point2[1] - point1[1]) / (point2[0] - point1[0])
    # 計算垂直於這條線的斜率
    vk = -1 / k
    # 計算線的端點座標
    line_point1 = (center_point[0] - 50, int(center_point[1] - vk * 50))
    line_point2 = (center_point[0] + 50, int(center_point[1] + vk * 50))

# 繪製出垂直線
cv2.line(img, line_point1, line_point2, (255, 0, 0), 1)

# 顯示圖像
cv2.imshow("image", img)
cv2.waitKey(0)
cv2.destroyAllWindows()
Posted on

取得輪廓的中心點

以下為範例程式:

import cv2

# 讀取圖像,並將其轉換為灰度圖像
img = cv2.imread("image.jpg")
gray = cv2.cvtColor(img, cv2.COLOR_BGR2GRAY)

# 進行閾值處理,以便更好地找到輪廓
ret, thresh = cv2.threshold(gray, 127, 255, 0)

# 查找輪廓
contours, hierarchy = cv2.findContours(thresh, cv2.RETR_TREE, cv2.CHAIN_APPROX_SIMPLE)

# 繪製輪廓,以便在圖像上進行視覺化
cv2.drawContours(img, contours, -1, (0, 255, 0), 3)

# 計算輪廓的中心點
if len(contours) > 0:
    # 取最大的輪廓
    c = max(contours, key=cv2.contourArea)
    # 計算輪廓的矩
    M = cv2.moments(c)
    # 計算中心點座標
    center_x = int(M["m10"] / M["m00"])
    center_y = int(M["m01"] / M["m00"])
    # 繪製中心點,以便在圖像上進行視覺化
    cv2.circle(img, (center_x, center_y), 5, (255, 0, 0), -1)

# 顯示圖像
cv2.imshow("image", img)
cv2.waitKey(0)
cv2.destroyAllWindows()
Posted on

如何分割黏在一起的撲克牌

範例說明

本文為參考下面的文章:
Image Segmentation with Distance Transform and Watershed Algorithm

這篇文章是OpenCV官方網站上的一篇教程,介紹了如何使用distanceTransform函數進行圖像分割。在這篇教程中,作者首先介紹了distanceTransform函數的基本概念和用法,然後通過一個實例演示了如何使用distanceTransform函數對圖像進行分割。

範例程式碼

以下為程式範例

from __future__ import print_function
import cv2 as cv
import numpy as np
import argparse
import random as rng
rng.seed(12345)
parser = argparse.ArgumentParser(description='Code for Image Segmentation with Distance Transform and Watershed Algorithm.\
    Sample code showing how to segment overlapping objects using Laplacian filtering, \
    in addition to Watershed and Distance Transformation')
parser.add_argument('--input', help='Path to input image.', default='cards.png')
args = parser.parse_args()
src = cv.imread(cv.samples.findFile(args.input))
if src is None:
    print('Could not open or find the image:', args.input)
    exit(0)
# Show source image
cv.imshow('Source Image', src)
src[np.all(src == 255, axis=2)] = 0
# Show output image
cv.imshow('Black Background Image', src)
kernel = np.array([[1, 1, 1], [1, -8, 1], [1, 1, 1]], dtype=np.float32)
# do the laplacian filtering as it is
# well, we need to convert everything in something more deeper then CV_8U
# because the kernel has some negative values,
# and we can expect in general to have a Laplacian image with negative values
# BUT a 8bits unsigned int (the one we are working with) can contain values from 0 to 255
# so the possible negative number will be truncated
imgLaplacian = cv.filter2D(src, cv.CV_32F, kernel)
sharp = np.float32(src)
imgResult = sharp - imgLaplacian
# convert back to 8bits gray scale
imgResult = np.clip(imgResult, 0, 255)
imgResult = imgResult.astype('uint8')
imgLaplacian = np.clip(imgLaplacian, 0, 255)
imgLaplacian = np.uint8(imgLaplacian)
#cv.imshow('Laplace Filtered Image', imgLaplacian)
cv.imshow('New Sharped Image', imgResult)
bw = cv.cvtColor(imgResult, cv.COLOR_BGR2GRAY)
_, bw = cv.threshold(bw, 40, 255, cv.THRESH_BINARY | cv.THRESH_OTSU)
cv.imshow('Binary Image', bw)
dist = cv.distanceTransform(bw, cv.DIST_L2, 3)
# Normalize the distance image for range = {0.0, 1.0}
# so we can visualize and threshold it
cv.normalize(dist, dist, 0, 1.0, cv.NORM_MINMAX)
cv.imshow('Distance Transform Image', dist)
_, dist = cv.threshold(dist, 0.4, 1.0, cv.THRESH_BINARY)
# Dilate a bit the dist image
kernel1 = np.ones((3,3), dtype=np.uint8)
dist = cv.dilate(dist, kernel1)
cv.imshow('Peaks', dist)
dist_8u = dist.astype('uint8')
# Find total markers
_, contours, _ = cv.findContours(dist_8u, cv.RETR_EXTERNAL, cv.CHAIN_APPROX_SIMPLE)
# Create the marker image for the watershed algorithm
markers = np.zeros(dist.shape, dtype=np.int32)
# Draw the foreground markers
for i in range(len(contours)):
    cv.drawContours(markers, contours, i, (i+1), -1)
# Draw the background marker
cv.circle(markers, (5,5), 3, (255,255,255), -1)
markers_8u = (markers * 10).astype('uint8')
cv.imshow('Markers', markers_8u)
cv.watershed(imgResult, markers)
#mark = np.zeros(markers.shape, dtype=np.uint8)
mark = markers.astype('uint8')
mark = cv.bitwise_not(mark)
# uncomment this if you want to see how the mark
# image looks like at that point
#cv.imshow('Markers_v2', mark)
# Generate random colors
colors = []
for contour in contours:
    colors.append((rng.randint(0,256), rng.randint(0,256), rng.randint(0,256)))
# Create the result image
dst = np.zeros((markers.shape[0], markers.shape[1], 3), dtype=np.uint8)
# Fill labeled objects with random colors
for i in range(markers.shape[0]):
    for j in range(markers.shape[1]):
        index = markers[i,j]
        if index > 0 and index <= len(contours):
            dst[i,j,:] = colors[index-1]
# Visualize the final image
cv.imshow('Final Result', dst)
cv.waitKey()

distanceTransform

distanceTransform函數是OpenCV中的一個函數,用於計算圖像中每個非零點到最近背景像素的距離。distanceTransform函數的第二個Mat矩陣參數dst保存了每個點與最近的零點的距離信息,圖像上越亮的點,代表了離零點的距離越遠。在這篇文章中,作者通過一個實例演示了如何使用distanceTransform函數對圖像進行分割。

在這個實例中,作者首先讀取了一張灰度圖像,然後使用threshold函數對圖像進行二值化處理。接著,作者使用distanceTransform函數計算了圖像中每個非零點到最近背景像素的距離,並將結果保存在了一個Mat矩陣中。最後,作者使用threshold函數對Mat矩陣進行二值化處理,得到了一張分割後的圖像。

需要注意的是,在使用distanceTransform函數時,需要先將圖像進行二值化處理。此外,在計算距離時,可以選擇歐氏距離、L1距離或L-infinity距離等不同的計算方式。

處理的過程圖片


其他參考資料

OpenCV C++/Obj-C: Advanced square detection

Posted on

拆分相黏的正方形

原始圖片

在寫純OpenCV的圖像辨識上,最困難的是當要找尋的目標的邊界因為模糊或相黏,而無法抓出正確的邊界的狀況
因為一般使用OpenCV做圖像辨識,我們都會需要先抓到例如說畫面中的某種色塊、再找尋某種符合某條件的形狀之類的
例如以修圖軟體而言,可能會需要先抓取膚色,然後轉換膚色的灰度階層取得面部的高低起伏,再根據灰度階層去抓取符合某種形狀的高低(如鼻子)或顏色差(如嘴巴、眼睛)

也因此,抓取正確的形狀在純粹的圖像辨識(沒有機器學習)的狀況下非常重要,而拆分相黏的形狀(如手放在臉前面),仍然要正確的辨識目標物件,也成了圖像辨識的一大挑戰
關於這一系列的其他文章,請見:

以下為這次我們要挑戰的目標,就是將這兩個黏在一起的正方形拆分為兩個正方形

解決問題的思考方向

首先我先參考官網的分水嶺演算法介紹:Image Segmentation with Watershed Algorithm
這邊的狀況和我們的需求很類似,都是將相黏的物件拆分開來

下面是在stackoverflow裡一位大大分享的他使用分水嶺演算法的範例程式:

from scipy.ndimage import label
import cv2
import numpy
def segment_on_dt(img):
    dt = cv2.distanceTransform(img, cv2.DIST_L2, 3) # L2 norm, 3x3 mask
    dt = ((dt - dt.min()) / (dt.max() - dt.min()) * 255).astype(numpy.uint8)
    dt = cv2.threshold(dt, 100, 255, cv2.THRESH_BINARY)[1]
    lbl, ncc = label(dt)

    lbl[img == 0] = lbl.max() + 1
    lbl = lbl.astype(numpy.int32)
    cv2.watershed(cv2.cvtColor(img, cv2.COLOR_GRAY2BGR), lbl)
    lbl[lbl == -1] = 0

在這篇文章裡有幾個函數需要我們去理解:

cv.distanceTransform

OpenCV的distanceTransform是一個圖像處理功能,可以計算圖像中每個像素到最近的零值像素之間的歐幾里德距離。distanceTransform功能可以在圖像分割、形狀檢測、物體識別等應用中使用。
在OpenCV中,distanceTransform有三種不同的實現方式:cv2.DIST_L1、cv2.DIST_L2和cv2.DIST_C。cv2.DIST_L1使用曼哈頓距離,cv2.DIST_L2使用歐幾里德距離,而cv2.DIST_C使用切比雪夫距離。
使用distanceTransform功能需要先將圖像二值化,然後計算圖像中每個像素到最近的零值像素之間的距離。distanceTransform返回的結果是一個浮點型的圖像,每個像素值表示該像素到最近的零值像素之間的距離。

以下是distanceTransform的Python程式碼示例:

import cv2
import numpy as np

img = cv2.imread('image.jpg', 0)
ret,thresh = cv2.threshold(img,127,255,0)
dist_transform = cv2.distanceTransform(thresh,cv2.DIST_L2,5)

以下為對上圖做cv.distanceTransform的結果

cv.threshold

將距離變換圖像dt進行歸一化處理,將其轉換成0-255之間的整數型圖像,並使用threshold函數將其二值化,生成一個二值化圖像dt。這個二值化圖像dt中的像素值只有0和255兩種,用來表示圖像中物體和背景之間的分界線。
在這邊我使用了0.9*dist_transform.max()來做為閥值,確認兩個方形之間可以不相連

ret, sure_fg = cv.threshold(dist_transform,0.9*dist_transform.max(),255,0)

結果如下:

cv2.connectedComponents

在圖像處理和計算機視覺中,常常需要將圖像分割成多個不同的區域,然後對每個區域進行不同的分析和處理。圖像分割的第一步就是對圖像進行連通區域標記,將相連的像素點標記為同一個區域,以便後續處理。

程式碼使用OpenCV中的label函數對二值化圖像dt進行連通區域標記,生成一個標記圖像lbl和連通區域數量ncc。標記圖像lbl中的每個像素點都標記了其所屬的連通區域編號。

OpenCV中提供了幾個函數可以實現連通區域標記,其中最常用的是cv2.connectedComponents和cv2.connectedComponentsWithStats函數,這些函數會將每個連通區域分配一個唯一的標籤(編號),並返回每個區域的一些統計信息,如面積、重心等。

scipy.ndimage.labelcv2.connectedComponents都是對二值化圖像中的連通區域進行標記的函數,但在實現和用法上有所不同。

scipy.ndimage.label是Scipy中的一個函數,用於對二值化圖像進行連通區域標記,它的使用方式如下:

from scipy.ndimage import label
labels, num_features = label(binary_image)

其中,binary_image是二值化的圖像,labels是與原始圖像大小相同的數組,其中每個像素點都標記了其所屬的連通區域編號,num_features是圖像中連通區域的數量。

cv2.connectedComponents是OpenCV中的一個函數,用於對二值化圖像進行連通區域標記,它的使用方式如下:

num_labels, labels = cv2.connectedComponents(binary_image)

binary_image是二值化的圖像,num_labels是圖像中連通區域的數量,labels是與原始圖像大小相同的數組,其中每個像素點都標記了其所屬的連通區域編號。

兩個函數的返回值不同,scipy.ndimage.label返回的是每個像素點所屬的連通區域編號,而cv2.connectedComponents返回的是每個連通區域的編號。另外,cv2.connectedComponents還可以通過修改設置參數來指定標記的種類,例如指定為4或8連通等。

cv2.watershed

程式碼將標記圖像lbl轉換成整數型數組,並使用OpenCV中的watershed函數進行分水嶺分割,生成一個分割圖像lbl。分割圖像lbl中的像素點表示原始圖像中的每個像素點所屬的區域編號。

cv2.watershed() 是 OpenCV 中的一種分割算法,通常用於分割圖像中的目標物體。

在使用該函數時,需要先對輸入的圖像進行預處理,以便生成一組用於分割的初始標記。這通常可以通過在原始圖像中標記前景和背景像素來實現。然後,可以將這些標記傳遞給 cv2.watershed() 函數進行分割。該函數會根據標記和圖像的梯度信息來確定目標物體的邊界,將其分割為不同的區域。

函數的語法如下:

markers = cv2.watershed(img, markers)

img 是輸入圖像,markers 是與輸入圖像相同大小的標記矩陣。在函數執行完畢後,markers 矩陣中每個像素的值將被設置為其所屬的分割區域的標記值。
需要注意的是,cv2.watershed() 函數是一個原地操作,即它會修改傳遞給它的標記矩陣,而不是返回一個新的矩陣。因此,在調用該函數之前,最好複製一份原始標記矩陣以備份。
cv2.watershed() 函數是一種基於圖像分水嶺的分割算法,它可以對灰度圖像進行分割,將圖像中的前景和背景分開。該算法的分割結果是基於圖像梯度的變化來進行分割的,因此不能直接實現直線分割。

# 應用watershed算法進行圖像分割
    markers = cv2.watershed(cv2.cvtColor(img, cv2.COLOR_GRAY2BGR), markers)
    # 根據標記將圖像分成不同的部分
    img[markers == -1] = 0

結果如下:

完整用法範例

import cv2
import numpy as np

# 創建一個黑白圖像
img = np.zeros((500, 500), dtype=np.uint8)
cv2.rectangle(img, (100, 100), (200, 200), 255, -1)
cv2.rectangle(img, (150, 150), (250, 250), 255, -1)

# 求出距離變換圖像
dt = cv2.distanceTransform(img, cv2.DIST_L2, 3)
dt = ((dt - dt.min()) / (dt.max() - dt.min()) * 255).astype(np.uint8)
# 閾值分割得到前景和背景
ret, thresh = cv2.threshold(dt, 0.8*dt.max(),255,0)
thresh = cv2.dilate(thresh, None, iterations=4)
unknown = cv2.subtract(img,thresh)
# 得到標記圖像,每個區域用不同的正整數標記
ret, markers = cv2.connectedComponents(thresh)
markers = markers+1
markers[unknown==255] = 0
# 應用watershed算法進行圖像分割
markers = cv2.watershed(cv2.cvtColor(img, cv2.COLOR_GRAY2BGR), markers)
# 根據標記將圖像分成不同的部分
img[markers == -1] = 0

# 顯示結果
cv2.imshow("img", img)
cv2.waitKey(0)
cv2.destroyAllWindows()
Posted on 1 Comment

如何檢測畫面中可能的正方形

最簡單-使用findContours

OpenCV 中有一個名為 findContours 的函數,可以用來查找圖像中的輪廓。一旦你找到了圖像中的輪廓,你可以使用 approxPolyDP 函數來近似地計算輪廓的形狀。如果你要查找正方形,你可以在這些形狀中尋找具有 4 個頂點的多邊形,這些多邊形應該有相近的邊長和角度。如果你要檢測的正方形不是水平的或垂直的,你可能需要使用角度信息來確定它的方向。

import cv2
# 读入图像
img = cv2.imread('square.jpg')

# 将图像转为灰度
gray = cv2.cvtColor(img, cv2.COLOR_BGR2GRAY)

# 使用 Canny 边缘检测
edges = cv2.Canny(gray, 50, 150)

# 寻找轮廓
contours, hierarchy = cv2.findContours(edges, cv2.RETR_EXTERNAL, cv2.CHAIN_APPROX_SIMPLE)

# 遍历轮廓
for contour in contours:
    # 近似计算轮廓
    approx = cv2.approxPolyDP(contour, 0.01 * cv2.arcLength(contour, True), True)
    # 如果是 4 个顶点的多边形,且边长和角度相近,则认为是正方形
    if len(approx) == 4 and cv2.isContourConvex(app

當我們可以取得相黏物件邊緣時 – 分水嶺演算法

分水嶺演算法-偵測相連區域形狀

當形狀邊緣不清楚時-使用霍夫找線

使用霍夫變換檢測直線。因為正方形的四條邊是直線,因此可以通過檢測這四條直線來確定正方形。

具體來說,可以使用 OpenCV 中的 HoughLinesP 函數來檢測直線。該函數會返回一組檢測到的線段,這些線段可以是任意方向和長度的線段,因此我們需要對這些線段進行篩選,只保留長度、方向和相對位置都符合要求的線段。接著,我們可以將這些線段按照一定的規則組合成四條邊,從而確定正方形。

以下是一個示例代碼,演示如何使用霍夫變換檢測正方形:

import cv2
import numpy as np

# 读入图像
img = cv2.imread('square.jpg')

# 将图像转为灰度
gray = cv2.cvtColor(img, cv2.COLOR_BGR2GRAY)

# 使用 Canny 边缘检测
edges = cv2.Canny(gray, 50, 150)

# 使用霍夫变换检测直线
lines = cv2.HoughLinesP(edges, 1, np.pi/180, 100, minLineLength=100, maxLineGap=10)

# 筛选直线
filtered_lines = []
for line in lines:
    x1, y1, x2, y2 = line[0]
    length = np.sqrt((x2-x1)**2 + (y2-y1)**2)
    angle = np.arctan2(y2-y1, x2-x1)
    # 保留长度在一定范围内的直线
    if 100 < length < 200:
        filtered_lines.append((length, angle, line))

# 组合直线
sides = []
for i, (length1, angle1, line1) in enumerate(filtered_lines):
    for j, (length2, angle2, line2) in enumerate(filtered_lines[i+1:], i+1):
        angle_diff = np.abs(angle1 - angle2)
        # 保留角度相近的直线
        if angle_diff < np.pi/4:
            # 计算两条直线的中心点
            x1, y1, x2, y2 = line1
            cx1, cy1 = (x1+x2)/2, (y1+y2)/2
            x1, y1, x2, y2 = line2
            cx2, cy2 = (x1+x2)/2, (y1+y2)/2
            center_diff = np.sqrt((cx2-cx1)**2 + (cy2-cy1)**2)
            # 保留中心点距离相近的直线
            if center_diff < 20:
                # 将两条直线组合成一条边
                sides.append((length1+length2, angle1, angle2, line1, line2))

# 按照长度排序,取前四条直线作为正方形的四条边
sides = sorted(sides
取前四条直线作为正方形的四条边
sides = sorted(sides, reverse=True)[:4]

计算正方形的四个顶点
corners = []
for i, (length1, angle1, angle2, line1, line2) in enumerate(sides):
for j, (length3, angle3, angle4, line3, line4) in enumerate(sides[i+1:], i+1):
# 计算两条直线的交点
x1, y1, x2, y2 = line1
cx1, cy1 = (x1+x2)/2, (y1+y2)/2
x1, y1, x2, y2 = line3
cx2, cy2 = (x1+x2)/2, (y1+y2)/2
k1 = np.tan(angle1)
k2 = np.tan(angle3)
x = (cy1 - cy2 + k2cx2 - k1cx1) / (k2 - k1)
y = k1*(x - cx1) + cy1
corners.append((x, y))

绘制正方形
for i in range(4):
x1, y1 = corners[i]
x2, y2 = corners[(i+1)%4]
cv2.line(img, (int(x1), int(y1)), (int(x2), int(y2)), (0, 255, 0), 3)

显示结果
cv2.imshow('image', img)
cv2.waitKey(0)
cv2.destroyAllWindows()

基於角點的角點檢測

哈里斯角點檢測器簡介

Harris Corner Detector 是一種角點檢測算子,常用於計算機視覺算法中以提取角點並推斷圖像的特徵。它由 Chris Harris 和 Mike Stephens 於 1988 年在 Moravec 的角檢測器改進後首次提出。Harris 角點檢測器相比之前的角點檢測器,直接考慮了角點分數的差異,直接參考方向,而不是每 45 度角使用 shifting patches,並被證明在區分邊緣和邊緣方面更準確。角落。從那以後,它被改進並被許多算法採用,為後續應用預處理圖像。

Posted on 2 Comments

分水嶺演算法-偵測相連區域形狀

官方教學

Image Segmentation with Watershed Algorithm
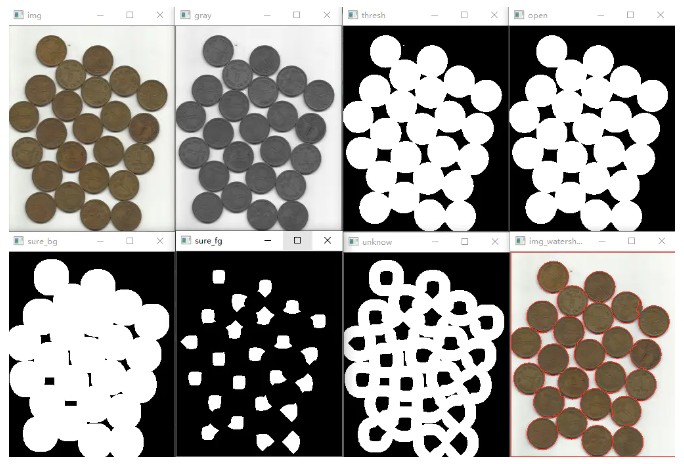
官方的範例是一群黏在一起的硬幣

分割出黏在一起的長方形

這篇文章是在討論如何分割出一群黏在一起的長方形

給定一個二值圖像,我們可以應用距離變換 (DT) 並從中獲得分水嶺的標記。理想情況下,會有一個現成的函數來查找區域最小值/最大值,但由於它不存在,我們可以對如何設置 DT 閾值做出一個不錯的猜測。基於標記,我們可以使用 Watershed 進行分割,問題就解決了。現在您可以擔心區分矩形組件和非矩形組件了。

OpenCV的distanceTransform是一個圖像處理功能,可以計算圖像中每個像素到最近的零值像素之間的歐幾里德距離。distanceTransform功能可以在圖像分割、形狀檢測、物體識別等應用中使用。

在OpenCV中,distanceTransform有三種不同的實現方式:cv2.DIST_L1、cv2.DIST_L2和cv2.DIST_C。cv2.DIST_L1使用曼哈頓距離,cv2.DIST_L2使用歐幾里德距離,而cv2.DIST_C使用切比雪夫距離。

曼哈頓距離也稱為城市區塊距離或L1距離。它是兩點之間水平和垂直距離的總和。如果p1和p2是兩個二維坐標點,則曼哈頓距離可以通過以下公式計算:

d(p1, p2) = |p1.x – p2.x| + |p1.y – p2.y|

歐幾里德距離是兩個點之間的直線距離。如果p1和p2是兩個二維坐標點,則歐幾里德距離可以通過以下公式計算:

d(p1, p2) = sqrt((p1.x – p2.x)^2 + (p1.y – p2.y)^2)

切比雪夫距離是兩個點之間在所有方向上的最大距離。如果p1和p2是兩個二維坐標點,則切比雪夫距離可以通過以下公式計算:

d(p1, p2) = max(|p1.x – p2.x|, |p1.y – p2.y|)

import sys
import cv2
import numpy
import random
from scipy.ndimage import label

def segment_on_dt(img):
    dt = cv2.distanceTransform(img, 2, 3) # L2 norm, 3x3 mask
    dt = ((dt - dt.min()) / (dt.max() - dt.min()) * 255).astype(numpy.uint8)
    dt = cv2.threshold(dt, 100, 255, cv2.THRESH_BINARY)[1]
    lbl, ncc = label(dt)

    lbl[img == 0] = lbl.max() + 1
    lbl = lbl.astype(numpy.int32)
    cv2.watershed(cv2.cvtColor(img, cv2.COLOR_GRAY2BGR), lbl)
    lbl[lbl == -1] = 0
    return lbl


img = cv2.cvtColor(cv2.imread(sys.argv[1]), cv2.COLOR_BGR2GRAY)
img = cv2.threshold(img, 0, 255, cv2.THRESH_OTSU)[1]
img = 255 - img # White: objects; Black: background

ws_result = segment_on_dt(img)
# Colorize
height, width = ws_result.shape
ws_color = numpy.zeros((height, width, 3), dtype=numpy.uint8)
lbl, ncc = label(ws_result)
for l in xrange(1, ncc + 1):
    a, b = numpy.nonzero(lbl == l)
    if img[a[0], b[0]] == 0: # Do not color background.
        continue
    rgb = [random.randint(0, 255) for _ in xrange(3)]
    ws_color[lbl == l] = tuple(rgb)

cv2.imwrite(sys.argv[2], ws_color)

從上圖中,您可以考慮在每個組件中擬合橢圓以確定矩形。然後您可以使用一些度量來定義組件是否為矩形。這種方法更有可能適用於完全可見的矩形,但對於部分可見的矩形可能會產生不良結果。下圖顯示了這種方法的結果,如果擬合橢圓的矩形在組件面積的 10% 以內,則組件是矩形。

# Fit ellipse to determine the rectangles.
wsbin = numpy.zeros((height, width), dtype=numpy.uint8)
wsbin[cv2.cvtColor(ws_color, cv2.COLOR_BGR2GRAY) != 0] = 255

ws_bincolor = cv2.cvtColor(255 – wsbin, cv2.COLOR_GRAY2BGR)
lbl, ncc = label(wsbin)
for l in xrange(1, ncc + 1):
yx = numpy.dstack(numpy.nonzero(lbl == l)).astype(numpy.int64)
xy = numpy.roll(numpy.swapaxes(yx, 0, 1), 1, 2)
if len(xy) < 100: # Too small. continue ellipse = cv2.fitEllipse(xy) center, axes, angle = ellipse rect_area = axes[0] * axes[1] if 0.9 < rect_area / float(len(xy)) < 1.1: rect = numpy.round(numpy.float64( cv2.cv.BoxPoints(ellipse))).astype(numpy.int64) color = [random.randint(60, 255) for _ in xrange(3)] cv2.drawContours(ws_bincolor, [rect], 0, color, 2) cv2.imwrite(sys.argv[3], ws_bincolor)[/code] 更多的資訊請參考: Advanced square detection (with connected region)

Posted on

The TechGiCS Forum

Experience Sharing

This morning, I attended a rare technology forum where all the speakers were women. Some were founders, and some were executives of internationally renowned companies, all of them outstanding and talented women. These women also have families and children and face struggles in balancing work and family life. Therefore, today’s speakers were different from the male-dominated technology forums, as they did not focus on the latest or most popular technology. They all emphasized that we should know ourselves, what we like, and what we want. They also mentioned the unique characteristics of women, who tend to feel that they are not good enough, not prepared enough, or not qualified enough.

What impressed me the most was during the final interview session, when a journalist from BUSINESS NEXT asked these women if they had planned to become outstanding women in the workplace from an early age. To our surprise, all the women answered that they did not have such a plan. They only took each step seriously and thoroughly understood themselves. 

As a woman who grew up under traditional thinking, but unexpectedly became the “Husband as homemaker, wife as breadwinner” family model because of my child, I understand why it’s important for women to first understand their passions. Being a career woman is often not supported by societal norms, and it’s only by finding happiness in our work that we can find the energy to persevere through the challenges of such a career.

Therefore, like Eunjoo Kim, a speaker who works at Google, who said that she did not intend to work in the United States originally. She only followed his husband, who needed to switch jobs. What she did was only to understand herself at every step, walk towards the direction she liked, work hard with passion, and then achieve her current success.

For me, my family role transformation was also a result of discovering that my child has special needs, which forced me to switch roles. Along the way, I deeply felt the impact of traditional thinking on our subconscious, which can greatly influence us. We may be pursuing a role that we don’t actually want to become, and sacrifice our careers. Or perhaps because we can’t find a good partner, even though we are in the workplace, our self-evaluation is low.

When we are not clear about what we are and what we want, We will feel like a candle burning at both ends, such as taking care of children, working outside, considering our husband’s feelings, and keeping ourselves beautiful. We can never do enough, and we cannot maintain a 25-year-old appearance and figure like celebrities, earn the same amount of money as our husbands and be economically independent, be a good mother, and also be a wise and virtuous wife.

It is precisely because women have too many choices now that we cannot have them all. We must recognize ourselves, what we are suitable for, what we want, what we can do, and what we like. Finding our own position is a prerequisite for being an outstanding woman.

Event Screenshot

CEO and Co-Founder at Women Who Code – Alaina Percival

Interview session by BUSINESS NEXT

Posted on

使用OBS來推流H265

使用OBS來推流H265

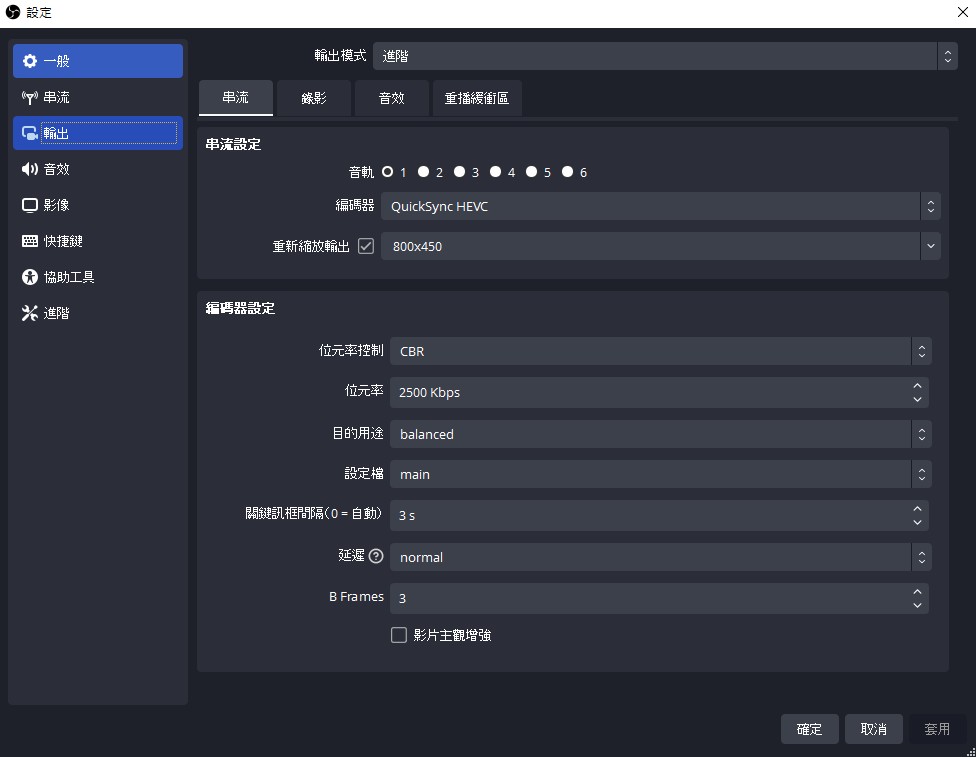
OBS也在v29板之後支持了HEVC推流,支持利用RTMP的封裝方式來推送H265編碼的串流格式,若電腦沒有可支持硬編碼的GPU,其CPU編碼所採取的編碼方案是QuickSync HEVC。

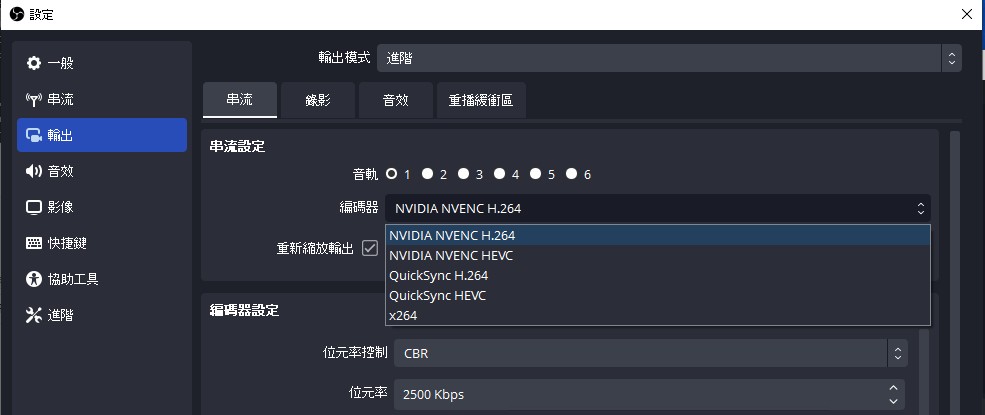
若是電腦有可支持硬編碼的GPU,則下拉選單會增加該硬件編碼的編碼選項

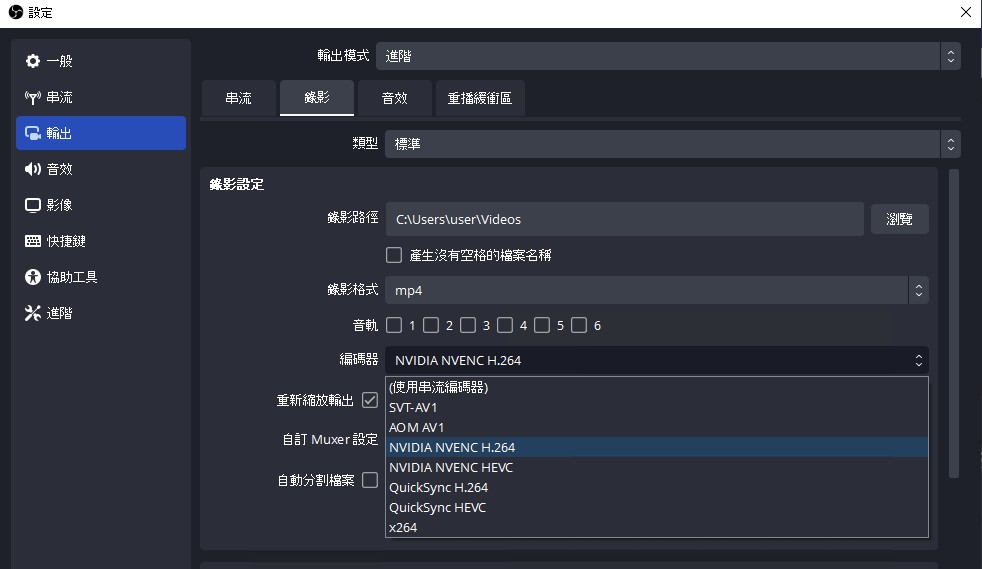
並且可以錄製SVT-AV1、AOM-AV1和HEVC的格式的影片