Posted on

使用模板匹配查找圖像中的對象

模板匹配

參考此篇教學: https://docs.opencv.org/4.x/d4/dc6/tutorial_py_template_matching.html
使用範例如下:

import cv2 as cv
import numpy as np
from matplotlib import pyplot as plt
img = cv.imread('messi5.jpg',0)
img2 = img.copy()
template = cv.imread('template.jpg',0)
w, h = template.shape[::-1]
# All the 6 methods for comparison in a list
methods = ['cv.TM_CCOEFF', 'cv.TM_CCOEFF_NORMED', 'cv.TM_CCORR',
            'cv.TM_CCORR_NORMED', 'cv.TM_SQDIFF', 'cv.TM_SQDIFF_NORMED']
for meth in methods:
    img = img2.copy()
    method = eval(meth)
    # Apply template Matching
    res = cv.matchTemplate(img,template,method)
    min_val, max_val, min_loc, max_loc = cv.minMaxLoc(res)
    # If the method is TM_SQDIFF or TM_SQDIFF_NORMED, take minimum
    if method in [cv.TM_SQDIFF, cv.TM_SQDIFF_NORMED]:
        top_left = min_loc
    else:
        top_left = max_loc
    bottom_right = (top_left[0] + w, top_left[1] + h)
    cv.rectangle(img,top_left, bottom_right, 255, 2)
    plt.subplot(121),plt.imshow(res,cmap = 'gray')
    plt.title('Matching Result'), plt.xticks([]), plt.yticks([])
    plt.subplot(122),plt.imshow(img,cmap = 'gray')
    plt.title('Detected Point'), plt.xticks([]), plt.yticks([])
    plt.suptitle(meth)
    plt.show()

使用cv.matchTemplate(), cv.minMaxLoc()與方式,當模板在圖片中被縮放或旋轉後,匹配成效不佳。
但實際應用中,物件在3D範圍內很常會被縮放或旋轉,就無法使用上述模板匹配方式

改良方法

嘗試Features2DFramework 中的 openCV 函數。例如SIFT或SURF描述符,以及FLANN匹配器。另外,您將需要findHomography方法。
這是在場景中查找旋轉對象的一個很好的例子。

簡而言之,算法是這樣的:

  • 尋找目標圖像的關鍵點(Keypoints)
  • 從這些關鍵點(Keypoints)中提取描述符(des)
  • 尋找場景圖像的關鍵點
  • 從關鍵點提取描述符
  • 通過匹配器匹配描述符
  • 分析圖片內容尋找目標圖像

有不同類別的 FeatureDetectors、DescriptorExtractors 和 DescriptorMatches,選擇適合的任務的那些。
以下為提取關鍵點的一個範例

from __future__ import print_function
import cv2
import numpy as np
import argparse
print(cv2.__version__)
img = cv2.imread('./D10.jpg', cv2.IMREAD_COLOR)
gray = cv2.cvtColor(img, cv2.COLOR_BGR2GRAY)

sift = cv2.SIFT_create()

kp = sift.detect(gray, None)


ret = cv2.drawKeypoints(gray, kp, img)
cv2.imshow('ret', ret)
cv2.waitKey(0)
cv2.destroyAllWindows()

kp, des = sift.compute(gray, kp)

print(np.shape(kp))
print(np.shape(des))

print(des[0])

更多資訊

Posted on

使用opencv尋找邊緣

使用Canny算子

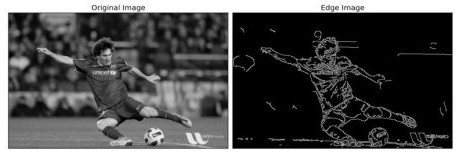
Canny 邊緣檢測是一種從不同的視覺對像中提取有用的結構信息並顯著減少要處理的數據量的技術。它已廣泛應用於各種計算機視覺系統。Canny發現,邊緣檢測在不同視覺系統上的應用需求是比較相似的。因此,可以在各種情況下實施滿足這些要求的邊緣檢測解決方案。邊緣檢測的一般標準包括:

錯誤率低的邊緣檢測,這意味著檢測應該盡可能準確地捕獲圖像中顯示的邊緣
算子檢測到的邊緣點應該準確地定位在邊緣的中心。
圖像中的給定邊緣應僅標記一次,並且在可能的情況下,圖像噪聲不應產生錯誤邊緣。

以下為一個簡單使用範例

import numpy as np
import cv2 as cv
from matplotlib import pyplot as plt
img = cv.imread('messi5.jpg',0)
edges = cv.Canny(img,100,200)
plt.subplot(121),plt.imshow(img,cmap = 'gray')
plt.title('Original Image'), plt.xticks([]), plt.yticks([])
plt.subplot(122),plt.imshow(edges,cmap = 'gray')
plt.title('Edge Image'), plt.xticks([]), plt.yticks([])
plt.show()
使用cartToPolar

使用 cv2.Sobel 函數計算圖像的梯度值和方向,並使用 cv2.cartToPolar 函數將梯度值和方向轉換為極坐標形式。

import numpy as np
import cv2
gray = cv2.imread('./unknow/img_2022-12-15_18-47-31_1.jpg')
gray = cv2.cvtColor(gray, cv2.COLOR_BGR2GRAY)
gray = gray/255.0
# 計算圖像的梯度值和方向
sobelx = cv2.Sobel(gray, cv2.CV_64F, 1, 0, ksize=1)
sobely = cv2.Sobel(gray, cv2.CV_64F, 0, 1, ksize=1)
magnitude, angle = cv2.cartToPolar(sobelx, sobely, angleInDegrees=True)

cv2.imshow("magnitude",magnitude)
cv2.imshow("angle",angle)
cv2.imshow("gray",gray)
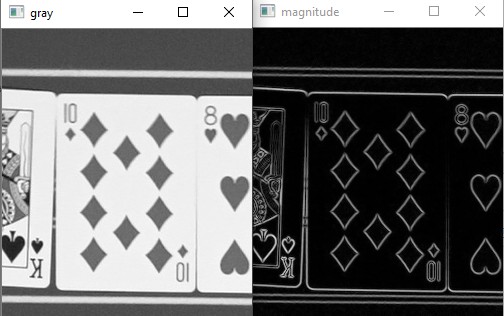
在上面的方法中,要注意的是使用cv.CV_64F能有較好的結果,若想要有CV_8U的結果,可以先採用CV_64F再用下面方式轉為CV_8U

# 輸出數據類型 = cv.CV_64F。然後取其絕對值並轉換為 cv.CV_8U
sobelx64f = cv.Sobel (img,cv.CV_64F,1,0,ksize=5)
abs_sobel64f = np.absolute(sobelx64f)
sobel_8u = np.uint8(abs_sobel64f)

分水嶺演算法

OpenCV 實現了一種基於標記的分水嶺算法,您可以在其中指定哪些是要合併的所有谷點,哪些不是。它是一種交互式圖像分割。我們所做的是為我們所知道的對象賦予不同的標籤。用一種顏色(或強度)標記我們確定是前景或物體的區域,用另一種顏色標記我們確定是背景或非物體的區域,最後是我們不確定的區域,用 0 標記它。那是我們的標記。然後應用分水嶺算法。然後我們的標記將使用我們提供的標籤進行更新,並且對象的邊界值為 -1。

import cv2
import numpy

img = cv2.imread("image/water_coins.jpg")
cv2.imshow("img", img)

# 1.圖像二值化
gray = cv2.cvtColor(img, cv2.COLOR_BGR2GRAY)
ret, thresh = cv2.threshold(gray, 0, 255, cv2.THRESH_BINARY_INV | cv2.THRESH_OTSU)

kernel = numpy.ones((3, 3), dtype=numpy.uint8)
# 2.噪聲去除
open = cv2.morphologyEx(thresh, cv2.MORPH_OPEN, kernel, iterations=2)
# 3.確定背景區域
sure_bg = cv2.dilate(open, kernel, iterations=3)
# 4.尋找前景區域
dist_transform = cv2.distanceTransform(open, 1, 5)
ret, sure_fg = cv2.threshold(dist_transform, 0.5 * dist_transform.max(), 255, cv2.THRESH_BINARY)
# 5.找到未知區域
sure_fg = numpy.uint8(sure_fg)
unknow = cv2.subtract(sure_bg, sure_fg)

# 6.類別標記
ret, markers = cv2.connectedComponents(sure_fg)
# 為所有的標記加1,保證背景是0而不是1
markers = markers + 1
# 現在讓所有的未知區域為0
markers[unknow == 255] = 0

# 7.分水嶺算法
markers = cv2.watershed(img, markers)
img[markers == -1] = (0, 0, 255)

cv2.imshow("gray", gray)
cv2.imshow("thresh", thresh)
cv2.imshow("open", open)
cv2.imshow("sure_bg", sure_bg)
cv2.imshow("sure_fg", sure_fg)
cv2.imshow("unknow", unknow)
cv2.imshow("img_watershed", img)
cv2.waitKey(0)
cv2.destroyWindow()
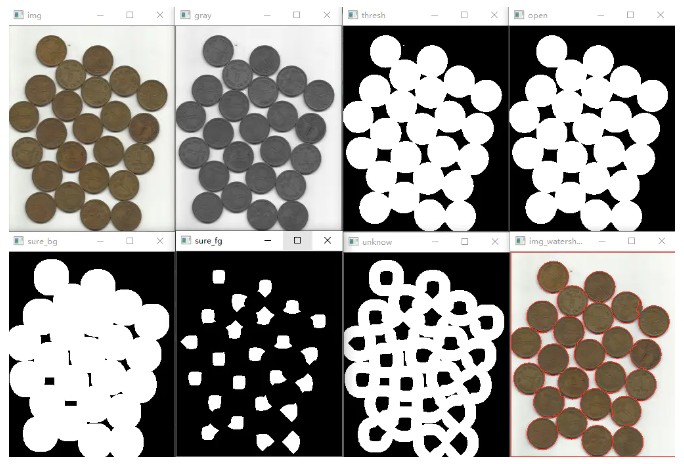

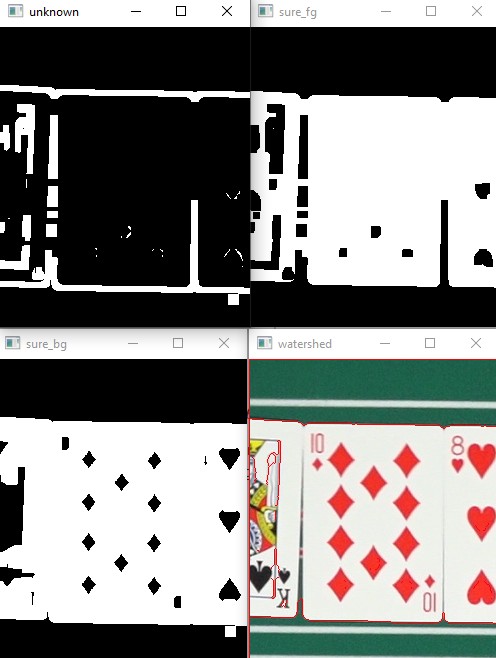
下面是我自己的嘗試

import numpy as np
import cv2 as cv
from matplotlib import pyplot as plt

img = cv.imread('./img_2022-12-15_18-47-31_1.jpg')
imageHSV = cv.cvtColor(img, cv.COLOR_BGR2HSV)
# 白色的部分
lower_white = np.array([0, 0, 220], dtype=np.uint8)
upper_white = np.array([180, 130, 255], dtype=np.uint8)
thresh = cv.inRange(imageHSV, lower_white, upper_white)

# noise removal
kernel = np.ones((3,3),np.uint8)
opening = cv.morphologyEx(thresh,cv.MORPH_OPEN,kernel, iterations = 2)
cv.imshow("opening",opening)

# sure background area - Green
sure_bg = cv.dilate(opening, kernel, iterations=3)
cv.imshow("sure_bg",sure_bg)

# Finding sure foreground area
# 紅色的部分
red_lower = np.array([0, 30, 100], dtype=np.uint8)
red_upper = np.array([30, 255, 240], dtype=np.uint8)
red_lower2 = np.array([135, 30, 100], dtype=np.uint8)
red_upper2 = np.array([180, 255, 240], dtype=np.uint8)
red_mask = cv.bitwise_or(cv.inRange(imageHSV, red_lower, red_upper),cv.inRange(imageHSV, red_lower2, red_upper2))
red_mask = cv.dilate(red_mask, kernel, iterations=3)
sure_fg = cv.bitwise_or(thresh, red_mask)

# 黑色的部分
black_lower = np.array([85, 0, 0], dtype=np.uint8)
black_upper = np.array([180, 40, 100], dtype=np.uint8)
black_lower2 = np.array([0, 0, 0], dtype=np.uint8)
black_upper2 = np.array([35, 40, 100], dtype=np.uint8)
black_mask = cv.bitwise_or(cv.inRange(imageHSV, black_lower, black_upper),cv.inRange(imageHSV, black_lower2, black_upper2))
black_mask = cv.dilate(black_mask, kernel, iterations=3)
cv.imshow("black_mask",black_mask)
sure_fg = cv.bitwise_or(sure_fg, black_mask)
sure_fg = cv.erode(sure_fg, kernel, iterations=3)
cv.imshow("sure_fg",sure_fg)

# Finding unknown region
sure_fg = np.uint8(sure_fg)
unknown = cv.subtract(sure_bg,sure_fg)
cv.imshow("unknown",unknown)
# Marker labelling
ret, markers = cv.connectedComponents(sure_fg)
# Add one to all labels so that sure background is not 0, but 1
markers = markers+1
# Now, mark the region of unknown with zero
markers[unknown==255] = 0

markers = cv.watershed(img,markers)
img[markers == -1] = (0, 0, 255)
cv.imshow("watershed",img)
cv.waitKey(0)
Posted on

圖片降維處理(從彩色變灰階再變黑白)

從彩色變灰階

使用 cv.cvtColor()函數可作色彩的空間轉換,例如要偵測顏色時,要轉成HSV

imageHSV = cv2.cvtColor(image, cv2.COLOR_BGR2HSV)

而降為灰階則為

imageHSV = cv2.cvtColor(image, cv2.COLOR_RGB2GRAY)

從灰階到黑白

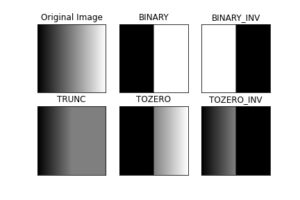
要把圖片從灰階變成黑白很簡單。對於每個像素,應用相同的閾值。如果像素值小於閾值,則設置為0,否則設置為最大值。函數cv.threshold用於應用閾值。第一個參數是源圖像,應該是灰度圖像。第二個參數是用於對像素值進行分類的閾值。第三個參數是分配給超過閾值的像素值的最大值。
可使用參數cv.thresholdcv.adaptiveThreshold

cv.threshold

使用範例

import cv2 as cv
import numpy as np
from matplotlib import pyplot as plt
img = cv.imread('gradient.png',0)
ret,thresh1 = cv.threshold(img,127,255,cv.THRESH_BINARY)
ret,thresh2 = cv.threshold(img,127,255,cv.THRESH_BINARY_INV)
ret,thresh3 = cv.threshold(img,127,255,cv.THRESH_TRUNC)
ret,thresh4 = cv.threshold(img,127,255,cv.THRESH_TOZERO)
ret,thresh5 = cv.threshold(img,127,255,cv.THRESH_TOZERO_INV)
titles = ['Original Image','BINARY','BINARY_INV','TRUNC','TOZERO','TOZERO_INV']
images = [img, thresh1, thresh2, thresh3, thresh4, thresh5]
for i in range(6):
    plt.subplot(2,3,i+1),plt.imshow(images[i],'gray',vmin=0,vmax=255)
    plt.title(titles[i])
    plt.xticks([]),plt.yticks([])
plt.show()

cv.adaptiveThreshold

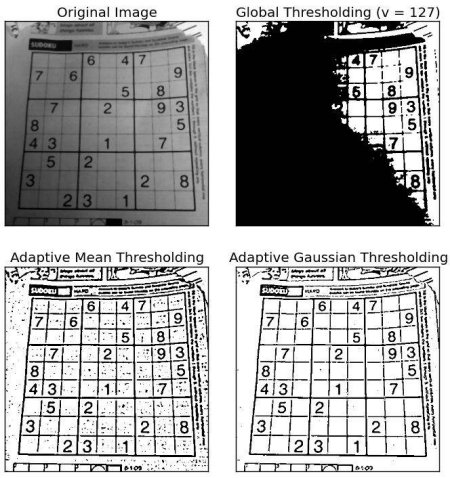
在cv.threshold使用一個全局值作為閾值。但這可能並不適用於所有情況,例如,如果圖像在不同區域具有不同的光照條件。在這種情況下,自適應閾值可以提供幫助。在這裡,算法根據像素周圍的小區域確定像素的閾值。因此,我們為同一圖像的不同區域獲得不同的閾值,這為具有不同光照的圖像提供了更好的結果。

除了上述參數外,方法cv.adaptiveThreshold 還需要三個輸入參數:

adaptiveMethod決定如何計算閾值:

  • cv.ADAPTIVE_THRESH_MEAN_C:閾值是鄰域面積的平均值減去常量C。
  • cv.ADAPTIVE_THRESH_GAUSSIAN_C :閾值是鄰域值減去常量C的高斯加權和。
  • blockSize確定鄰域區域的大小,C是從鄰域像素的平均值或加權總和中減去的常數。

下面比較了具有不同光照的圖像的全局閾值和自適應閾值:

import cv2 as cv
import numpy as np
from matplotlib import pyplot as plt
img = cv.imread('sudoku.png',0)
img = cv.medianBlur(img,5)
ret,th1 = cv.threshold(img,127,255,cv.THRESH_BINARY)
th2 = cv.adaptiveThreshold(img,255,cv.ADAPTIVE_THRESH_MEAN_C,\
            cv.THRESH_BINARY,11,2)
th3 = cv.adaptiveThreshold(img,255,cv.ADAPTIVE_THRESH_GAUSSIAN_C,\
            cv.THRESH_BINARY,11,2)
titles = ['Original Image', 'Global Thresholding (v = 127)',
            'Adaptive Mean Thresholding', 'Adaptive Gaussian Thresholding']
images = [img, th1, th2, th3]
for i in range(4):
    plt.subplot(2,2,i+1),plt.imshow(images[i],'gray')
    plt.title(titles[i])
    plt.xticks([]),plt.yticks([])
plt.show()

cv.threshold使用THRESH_OTSU

在全局閾值中,使用任意選擇的值作為閾值。相反,Otsu 的方法避免了必須選擇一個值並自動確定它。

考慮只有兩個不同圖像值的圖像(雙峰圖像),其中直方圖僅包含兩個峰值。一個好的閾值應該在這兩個值的中間。類似地,Otsu 的方法從圖像直方圖中確定最佳全局閾值。
為此,使用了cv.threshold()函數,其中cv.THRESH_OTSU作為額外標誌傳遞。閾值可以任意選擇。然後算法找到最佳閾值,該閾值作為第一個輸出返回。
查看下面的示例。輸入圖像是有噪聲的圖像。在第一種情況下,應用值為 127 的全局閾值。在第二種情況下,直接應用 Otsu 的閾值。在第三種情況下,首先使用 5×5 高斯核對圖像進行濾波以去除噪聲,然後應用 Otsu 閾值處理。查看噪聲過濾如何改善結果。

import cv2 as cv
import numpy as np
from matplotlib import pyplot as plt
img = cv.imread('noisy2.png',0)
# global thresholding
ret1,th1 = cv.threshold(img,127,255,cv.THRESH_BINARY)
# Otsu's thresholding
ret2,th2 = cv.threshold(img,0,255,cv.THRESH_BINARY+cv.THRESH_OTSU)
# Otsu's thresholding after Gaussian filtering
blur = cv.GaussianBlur(img,(5,5),0)
ret3,th3 = cv.threshold(blur,0,255,cv.THRESH_BINARY+cv.THRESH_OTSU)
# plot all the images and their histograms
images = [img, 0, th1,
          img, 0, th2,
          blur, 0, th3]
titles = ['Original Noisy Image','Histogram','Global Thresholding (v=127)',
          'Original Noisy Image','Histogram',"Otsu's Thresholding",
          'Gaussian filtered Image','Histogram',"Otsu's Thresholding"]
for i in range(3):
    plt.subplot(3,3,i*3+1),plt.imshow(images[i*3],'gray')
    plt.title(titles[i*3]), plt.xticks([]), plt.yticks([])
    plt.subplot(3,3,i*3+2),plt.hist(images[i*3].ravel(),256)
    plt.title(titles[i*3+1]), plt.xticks([]), plt.yticks([])
    plt.subplot(3,3,i*3+3),plt.imshow(images[i*3+2],'gray')
    plt.title(titles[i*3+2]), plt.xticks([]), plt.yticks([])
plt.show()
Posted on

對圖像做幾何變換

目標

學習對圖像應用不同的幾何變換,如平移、旋轉、仿射變換等。
你會看到這些功能:cv.getPerspectiveTransform

縮放

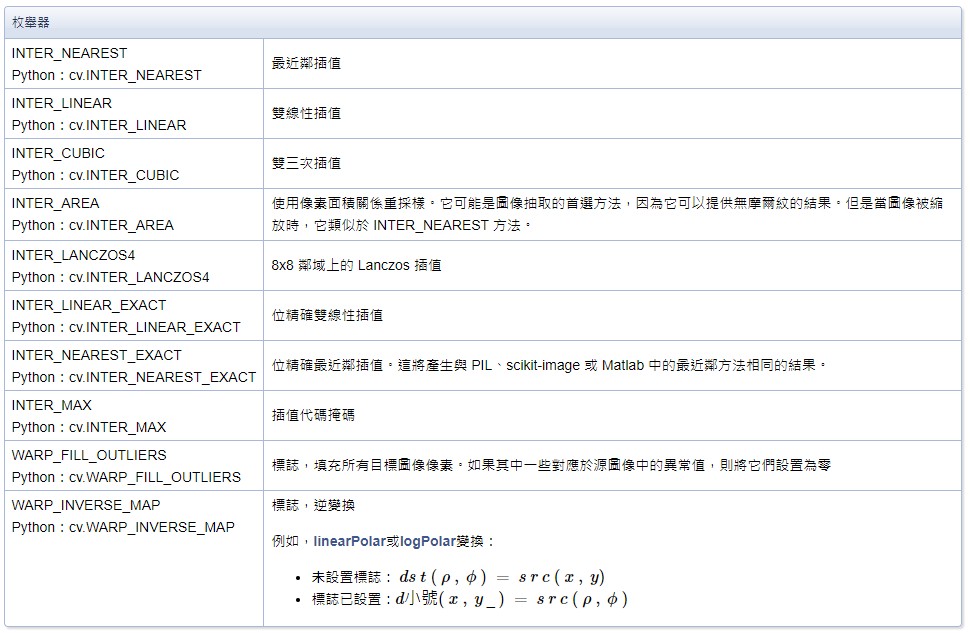
只是調整圖像的大小。interpolation參數有下面幾種

使用範例

import numpy as np
import cv2 as cv
img = cv.imread('messi5.jpg')
res = cv.resize(img,None,fx=2, fy=2, interpolation = cv.INTER_CUBIC)
#OR
height, width = img.shape[:2]
res = cv.resize(img,(2*width, 2*height), interpolation = cv.INTER_CUBIC)

平移

平移影像,下面程式會將圖,x 軸平移 100,y 軸平移 50

import numpy as np
import cv2 as cv
img = cv.imread('messi5.jpg',0)
rows,cols = img.shape
M = np.float32([[1,0,100],[0,1,50]])# 2x3 矩陣,x 軸平移 100,y 軸平移 50
dst = cv.warpAffine(img,M,(cols,rows))
cv.imshow('img',dst)
cv.waitKey(0)
cv.destroyAllWindows()

旋轉影像

img = cv.imread('messi5.jpg',0)
rows,cols = img.shape
# cols-1 and rows-1 are the coordinate limits.
M = cv.getRotationMatrix2D(((cols-1)/2.0,(rows-1)/2.0),90,1) # 中心點 ((cols-1)/2.0,(rows-1)/2.0)),旋轉 90 度,尺寸 1
dst = cv.warpAffine(img,M,(cols,rows))

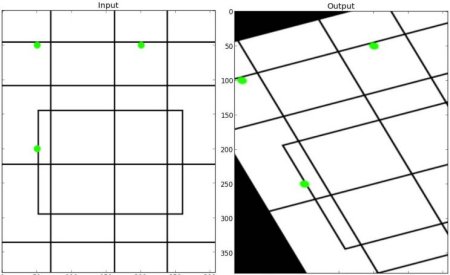
仿射變換

img = cv.imread('drawing.png')
rows,cols,ch = img.shape
pts1 = np.float32([[50,50],[200,50],[50,200]])
pts2 = np.float32([[10,100],[200,50],[100,250]])
M = cv.getAffineTransform(pts1,pts2)
dst = cv.warpAffine(img,M,(cols,rows))
plt.subplot(121),plt.imshow(img),plt.title('Input')
plt.subplot(122),plt.imshow(dst),plt.title('Output')
plt.show()

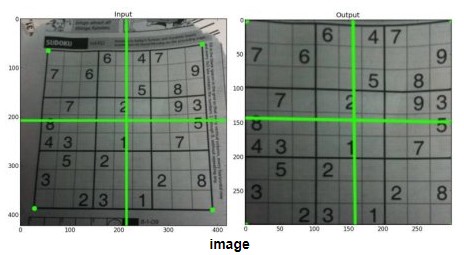
透視變換

這個方法可以把3D的有角度的長方形,拉成2D的長方形,很常會用來使用在3為空間的像照片、名片等拉平的效果上

img = cv.imread('sudoku.png')
rows,cols,ch = img.shape
pts1 = np.float32([[56,65],[368,52],[28,387],[389,390]])
pts2 = np.float32([[0,0],[300,0],[0,300],[300,300]])
M = cv.getPerspectiveTransform(pts1,pts2)
dst = cv.warpPerspective(img,M,(300,300))
plt.subplot(121),plt.imshow(img),plt.title('Input')
plt.subplot(122),plt.imshow(dst),plt.title('Output')
plt.show()

Posted on

opencv圖像運算

理論

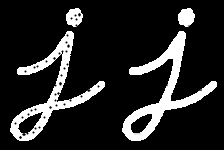
形態變換是一些基於圖像形狀的簡單操作。它通常在二進製圖像上執行。它需要兩個輸入,一個是我們的原始圖像,第二個稱為結構元素或內核,它決定了操作的性質。兩個基本的形態學算子是侵蝕和膨脹。然後它的變體形式如開、閉、梯度等也開始發揮作用。我們將在下圖的幫助下一一看到它們:

侵蝕cv2.erode

侵蝕的基本思想就像土壤侵蝕一樣,它侵蝕掉前景物體的邊界(總是盡量讓前景保持白色)。那它有什麼作用呢?內核在圖像中滑動(如在 2D 卷積中)。只有當內核下的所有像素都為 1 時,原始圖像中的像素(1 或 0)才會被認為是 1,否則它會被腐蝕(變為零)。

所以發生的事情是,根據內核的大小,邊界附近的所有像素都將被丟棄。因此,前景對象的厚度或大小會減少,或者圖像中的白色區域會減少。它對於去除小的白噪聲(正如我們在色彩空間章節中看到的)、分離兩個連接的對像等很有用。

在這裡,作為一個例子,我會使用一個 5×5 的內核。讓我們看看它是如何工作的:

import cv2 as cv
import numpy as np
img = cv2.imread('j.png',0)
kernel = np.ones((5,5),np.uint8)
erosion = cv2.erode(img,kernel,iterations = 1)

膨脹Dilation

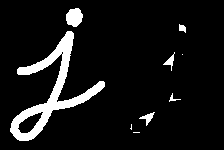
它與侵蝕正好相反。這裡,如果內核下的至少一個像素為“1”,則像素元素為“1”。因此它增加了圖像中的白色區域或前景對象的大小增加。通常,在去除噪聲等情況下,腐蝕之後是膨脹。因為,腐蝕去除了白噪聲,但它也縮小了我們的對象。所以我們擴大它。由於噪音消失了,它們不會回來,但我們的對象區域增加了。它還可用於連接對象的損壞部分。

dilation = cv2.dilate(img,kernel,iterations = 1)

去噪cv2.MORPH_OPEN

在去除噪聲方面很有用。這裡我們使用函數cv2.morphologyEx()

opening = cv2.morphologyEx(img, cv2.MORPH_OPEN, kernel)

關閉線條

對關閉前景對象內的小孔或對像上的小黑點很有用。這個我也有使用來把canny所找到的邊緣關起來

closing = cv2.morphologyEx (img, cv2.MORPH_CLOSE, kernel)

形態梯度

這是圖像膨脹和腐蝕之間的區別。結果將看起來像對象的輪廓。

gradient = cv2.morphologyEx (img, cv2.MORPH_GRADIENT, kernel)

Top Hat

使用cv2.MORPH_TOPHAT

tophat = cv2.morphologyEx(img, cv2.MORPH_TOPHAT, kernel)

Black Hat

使用cv2.MORPH_GRADIENT

gradient = cv2.morphologyEx (img, cv2.MORPH_GRADIENT, kernel)

更多資訊: https://homepages.inf.ed.ac.uk/rbf/HIPR2/morops.htm

Posted on

使用opencv做圖片後製處理(如ps)

這個部落格有一個系列文:
12th 鐵人賽 – 【錢不夠買ps的我,只好用OpenCV來修圖了!】
分享了非常多好用的圖片後製方法
這邊分享幾個我覺得不錯的

黑強化

強化有顏色區域的深度

# do pre-process (black strengthen) in OCR
def image_filter(img, degree = 3):
    # degree is from 0 to Unlimited, bigger number => bigger strengthen
    decrease_img = (255.0/1)*(img/(255.0/1))**degree
    decrease_img = np.array(decrease_img, dtype=np.uint8)
    return decrease_img

白平衡

圖像光照校正處理

def mean_white_balance(img):
    b, g, r = cv2.split(img)
    r_avg = cv2.mean(r)[0]
    g_avg = cv2.mean(g)[0]
    b_avg = cv2.mean(b)[0]
    k = (r_avg + g_avg + b_avg) / 3
    kr = k / r_avg
    kg = k / g_avg
    kb = k / b_avg
    r = cv2.addWeighted(src1=r, alpha=kr, src2=0, beta=0, gamma=0)
    g = cv2.addWeighted(src1=g, alpha=kg, src2=0, beta=0, gamma=0)
    b = cv2.addWeighted(src1=b, alpha=kb, src2=0, beta=0, gamma=0)
    balance_img = cv2.merge([b, g, r])
    return balance_img

雙邊濾波

雙邊濾波(Bilateral filter)是一種非線性的濾波方法,是結合圖像的空間鄰近度和像素值相似度的一種折衷處理,同時考慮空域信息和灰度相似性,達到保邊去噪的目的。具有簡單、非迭代、局部的特點。

image = cv2.bilateralFilter(image, 5, 30, 30)
Posted on

使用opencv來找出紅色區塊

使用HSV色碼轉換器

一個好用的線上工具
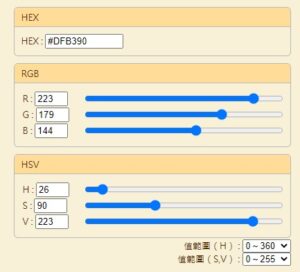
色碼轉換器: https://www.peko-step.com/zhtw/tool/hsvrgb.html

若要將轉換過的顏色套用到python的色碼,記得將S,V的範圍改為0-255
然後從網站上看到的H的值(如這邊為26)要除以2,也就是13

以上圖來說,上面顯示的色碼為HSV:(26,90,223),然後填進python裡面要使用HSV:(13,90,223)

python裡面的HSV識別空間

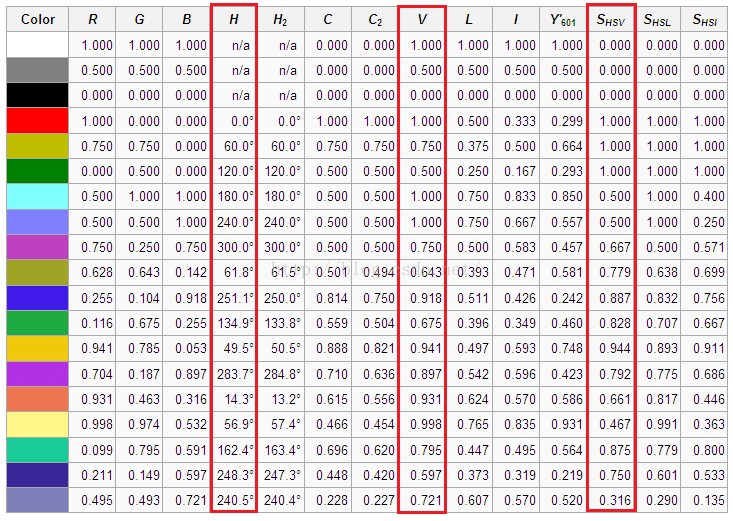
一般對顏色空間的圖像進行有效處理都是在HSV空間進行的,然後對於基本色中對應的HSV分量的範圍為:
H: 0 — 180
S: 0 — 255
V: 0 — 255

基本HSV的顏色劃分


HSV的意義

HSB又稱HSV,表示一種顏色模式:在HSB模式中,H(hues)表示色相,S(saturation)表示飽和度,B(brightness)表示亮度HSB模式對應的媒介是人眼。
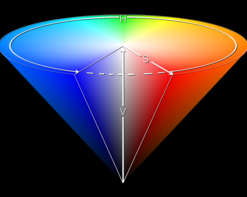
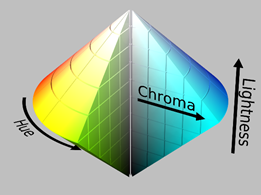
HSL 和HSV 二者都把顏色描述在圓柱體內的點,這個圓柱的中心軸取值為自底部的黑色到頂部的白色而在它們中間是的灰色,繞這個軸的角度對應於“色相”,到這個軸的距離對應於“飽和度”,而沿著這個軸的距離對應於“亮度”,“色調”或“明度”。這兩種表示在用目的上類似,但在方法上有區別。


二者在數學上都是圓柱,但HSV(色相,飽和度,明度)在概念上可以被認為是顏色的倒圓錐體(黑點在下頂點,白色在上底面圓心),HSL在概念上表示了一個雙圓錐體和圓球體(白色在上頂點,黑色在下頂點,最大橫切面的圓心是半程灰色)。注意儘管在HSL 和HSV 中“色相”指稱相同的性質,它們的“飽和度”的定義是明顯不同的。

抓取圖片中膚色大小大小

import cv2
def find_white_color_size(image, upper, lower, upper2 = None, lower2 = None):
    imageHSV = cv2.cvtColor(image, cv2.COLOR_BGR2HSV)
    mask = cv2.inRange(imageHSV, lower, upper)
    if lower2 is not None and upper2 is not None:
        mask2 = cv2.inRange(imageHSV, lower2, upper2)
        mask = cv2.bitwise_or(mask, mask2)
    area = 0;
    for i in range(len(mask)):
        filter_color = mask[i] > 0
        area += len(mask[i][filter_color])
    return area

lower_red1 = np.array([0, 70, 100], dtype=np.uint8)
upper_red1 = np.array([20, 120, 240], dtype=np.uint8)
lower_red2 = np.array([150, 70, 100], dtype=np.uint8)
upper_red2 = np.array([180, 120, 240], dtype=np.uint8)
print('color size:',find_white_color_size(card_image, upper_red1, lower_red1, upper_red2, lower_red2))
Posted on

python的socket-io-client 4.5.1不會自動重連問題

問題版本

python-socketio 4.5.1
相關討論串: https://github.com/miguelgrinberg/python-socketio/issues/485
can not reconnect after 503 error

解決方法

自己寫重連的程式碼

import socketio
from threading import Timer

timer = None
address = "http://127.0.0.1:2027"
sio = socketio.Client(reconnection=False, logger=False, engineio_logger=False)
isConnected = False

def connectSocket():
    global timer
    try:
        sio.connect(address, transports='polling')
    except:
        if timer is not None:
            timer.cancel()
        timer = Timer(1.0, connectSocket)
        timer.start()

def close():
    global sio
    global timer
    global isConnected
    sio.disconnect()
    isConnected = False
    if timer is not None:
        timer.cancel()

@sio.event
def test():
    print('(test)'


def send(data):
    sio.emit('send', data)


@sio.event
def connect():
    global isConnected
    print('(connect)')


@sio.event
def disconnect():
    global timer
    global isConnected
    print('(disconnected)')
    sio.disconnect()
    isConnected = False
    if timer is not None:
        timer.cancel()
    timer = Timer(1.0, connectSocket)
    timer.start()

Posted on

把普羅米修斯的資料打到ELK

下載Metricbeat的docker版本​

官網介紹: https://www.elastic.co/beats/metricbeat
其中給普羅米修斯使用的模組為: https://www.elastic.co/guide/en/beats/metricbeat/current/metricbeat-module-prometheus.html
官方映像檔: https://hub.docker.com/r/elastic/metricbeat
下載映像檔

docker pull docker.elastic.co/beats/metricbeat:8.5.3

新建一個Metricbeat的Pod​

設定metrucbeat的deployment

apiVersion: apps/v1
kind: Deployment
metadata:
  name: metricbeat
  namespace: default
spec:
  progressDeadlineSeconds: 600
  replicas: 1
  revisionHistoryLimit: 10
  selector:
    matchLabels:
      workload.user.cattle.io/workloadselector: apps.deployment-srs3-metricbeat
  template:
    spec:
      affinity: {}
      containers:
      - image: dev-registry.xycloud.org/ldr/streaming/metricbeat
        imagePullPolicy: Always
        name: metricbeat
        resources: {}
        terminationMessagePath: /dev/termination-log
        terminationMessagePolicy: File
        volumeMounts:
        - mountPath: /usr/share/metricbeat/metricbeat.yml
          name: vol0
          subPath: metricbeat.yml
        - mountPath: /usr/share/metricbeat/prometheus.yml
          name: vol0
          subPath: prometheus.yml
      dnsPolicy: ClusterFirst
      imagePullSecrets:
      - name: regsecret
      restartPolicy: Always
      schedulerName: default-scheduler
      securityContext: {}
      terminationGracePeriodSeconds: 30
      volumes:
      - configMap:
          defaultMode: 420
          name: filebeat-config
        name: vol0

設定兩個config​

metricbeat.yml​

metricbeat.config.modules:​
  path: ${path.config}/modules.d/*.yml​
  reload.enabled: false​
metricbeat.max_start_delay: 10s​
output.logstash:​
  enabled: true​
  hosts: ["logstash-logstash.tool-elk.svc.cluster.local:5043"]​
  index: 'metricbeat'​
  logging.level: info​
logging.metrics.enabled: false​
logging.metrics.period: 30s​

prometheus.yml​

- module: prometheus​
  metricsets: ["query"]​
  hosts: ["http://rancher-monitoring-prometheus.cattle-monitoring-system.svc.cluster.local:9090"]​
  period: 10s​
  queries:​
  - name: "stream_total_clients_by_pod"​
    path: "/api/v1/query"​
    params:​
      query: "stream_total_clients_by_pod"​

把這兩個config mount進pod的在/usr/share/metricbeat​

Posted on 1 Comment

Prometheus Rule for Alert​

Prometheus Rule功能介紹

Prometheus Rule 是用於在 Prometheus 中定義規則的 YAML 配置文件。它可以根據指定的表達式或條件對 metrics 進行匹配和計算,並在達到一定條件時生成警報或創建新的 metrics。

Prometheus Rule 的主要功能如下:

  • Metrics 計算:通過表達式對符合條件的 metrics 進行匹配和計算,生成新的 metrics。
  • 警報:當符合指定條件的 metrics 達到一定閾值時,生成警報。
  • 規則繫結:可以為指定的 metrics 繫結指定的規則,進行自動化的警報觸發。
  • 標註註釋:在生成警報時可以加上自定義的標註和註釋,方便後續的統計和分析。

通常在配合 Grafana 等圖形化界面使用時,Prometheus Rule 可以讓用戶方便的自定義需要監控的 metrics,並在 Grafana 上實現對這些 metrics 的實時監控和報警,以實現系統的實時監控和異常處理。

設定Prometheus Rule

這是一個 PrometheusRule YAML 配置文件,用於定義 Prometheus 規則,以檢測和警報指定的 metrics。

apiVersion: monitoring.coreos.com/v1
kind: PrometheusRule
metadata:
  labels:
    name: srs-online-member
  name: srs-online-member
  namespace: stu-srs
spec:
  groups:
  - name: srs-online-member
    rules:
    - expr: sum(stream_clients_clients{container="json-exporter", name=~".+",namespace=~"stu-srs",pod=~"srs-edge.+"})
        by (pod)
      labels:
        name: online-member-high
        namespace: stu-srs
        service: eventqueue
      record: stream_total_clients_by_pod
  - name: quay-alert.rules
    rules:
    - alert: online-member-full
      annotations:
        message: online-member-full {{ $labels.pod }} at {{ $value }}%
      expr: sum(stream_clients_clients{container="json-exporter", name=~".+",namespace=~"stu-srs",pod=~"srs-edge.+"})
        by (pod) > 1000
      for: 5m
      labels:
        severity: warning

該文件定義了兩個規則組,每個規則組包含一個或多個規則。

第一個規則組名為 srs-online-member,包含一個規則。該規則通過表達式 sum(stream_clients_clients{container="json-exporter", name=~".+",namespace=~"stu-srs",pod=~"srs-edge.+"}) by (pod) 求和符合條件的 metrics,這些 metrics 包含在 stream_clients_clients 中,該 metrics 必須滿足以下條件:在命名空間 stu-srs 中,容器名稱為 json-exporter,Pod 名稱符合正則表達式 srs-edge.+。

如果條件滿足,Prometheus 將會創建一個名為 stream_total_clients_by_pod 的時間序列,其中 pod 是標籤,值是符合條件的 Pod 名稱,這樣可以讓你在 Grafana 等圖形化界面上顯示時間序列並進行分析。

第二個規則組名為 quay-alert.rules,包含一個警報規則。該規則通過表達式 sum(stream_clients_clients{container="json-exporter", name=~".+",namespace=~"stu-srs",pod=~"srs-edge.+"}) by (pod) > 1000 檢查符合條件的 metrics 是否大於 1000。如果條件滿足 5 分鐘以上,Prometheus 將會發出名為 online-member-full 的警報,並設置一些額外的標籤和注釋以便進一步分析。

設定alert規則

我們也可以在Rule裡面設定Alert的規則,當有labels的Severity為warning時,就代表這個rule為一個告警,下面是代表當pod的人數大於1000多過五分鐘時,會觸發告警

  - name: quay-alert.rules
    rules:
    - alert: online-member-full
      annotations:
        message: online-member-full {{ $labels.pod }} at {{ $value }}%
      expr: sum(stream_clients_clients{container="json-exporter", name=~".+",namespace=~"default",pod=~"my-pod.+"})
        by (pod) > 1000
      for: 5m
      labels:
        severity: warning

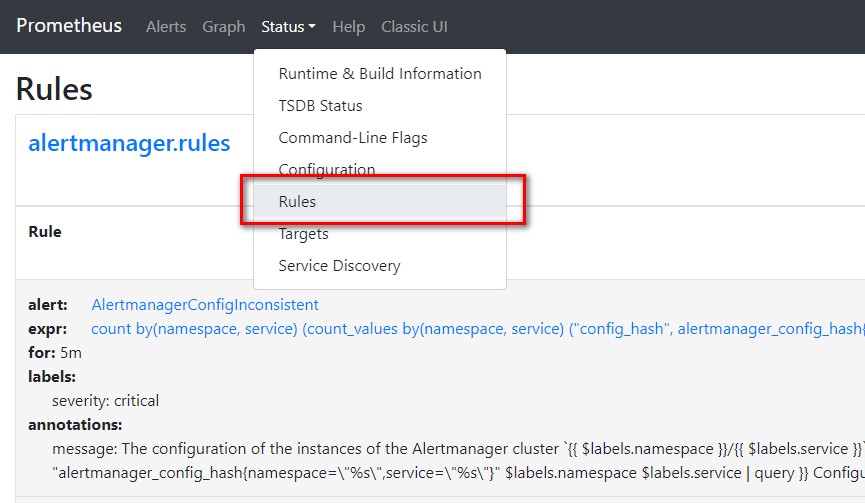
可以在Prometheus Web UI的Alert頁籤裡找到這個設定值​